

Continued Hot Today Into The Weekend - A Break Next Week.

NWS NDFD Forecast High Temperatures Anomalies Today.

Parts of Southeastern New Mexico and West Texas will top out today at or just above 100ºF. On average these readings will be about 5-degrees above normal for the date. Saturday and Sunday will see similar high temperatures.
NWS NDFD Forecast High Temperatures Wednesday.

NWS NDFD Forecast High Temperatures Anomalies Wednesday.

A weak cold front is forecast to approach the area Monday as the center of the upper level high pressure shifts northwest into the Central Rockies next week. This will allow a decent fetch of low level upslope flow the east and southeast into the state and turn the flow aloft to the northwest and north. Meaning that these weak cold fronts will have a better chance to enter the area and the steering winds aloft will drive thunderstorms off of the mountains and southeastward out onto the plains.
By early next week we should cool down enough with the added moisture and a cooler and more unstable air mass in place that our high temps will drop down to near 90ºF Tuesday, and the upper 80's on Wednesday.
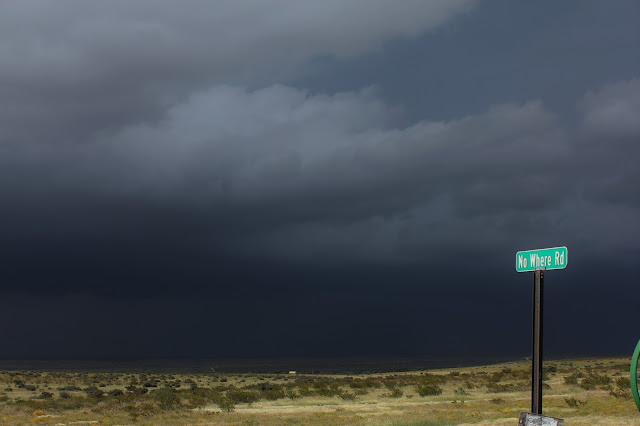
Increasing Chances For Thunderstorms & Cooler Next Week.

The long range models are picking up on this trend and this is reflected in the Weather Prediction Centers (WPC) total rainfall forecast depicted above. Note that the heaviest rains are forecast to fall next week along and near the cold front. The further south the cooler air can come the better our chances of seeing higher rainfall totals locally.
Rainfall Totals Close To Average So Far This Year.
(Jan 1st -Jul 27th, 2017).

Local Year-To-Date Rainfall Anomalies.
(Jan 29th -Jul 27th, 2017).

Rainfall so far this year in the region has been hit and miss with some areas above normal so far this year while other areas are below normal. Nothing unusual about that. Parts of the Sacramento and Guadalupe mountains are running below normal as well as parts of the Southeastern plains.
Local CoCoRaHS Year-To-Date Rainfall Totals.
(Jan 1st - Jul 27th, 2017).
(Jan 1st - Jul 27th, 2017).


Local Rainfall Totals & Averages.
(Year-To-Date Totals Verses Normal-To-Date Totals).
(Year-To-Date Is From Jan 1st - July 27th, 2017).
(1905 - 2017)
YTD- 8.85" Normal YTD- 8.71"
Wettest YTD Total In 1941- 28.13"
Driest YTD Total In 1930- .39"
Roswell, NM.
(1893 - 2017)
(1893 - 2017)
YTD- 4.77" Normal YTD- 6.80"
Wettest YTD Total In 1941- 19.17"
Driest YTD Total In 1893- .85"
(1905 - 2017)
YTD- 5.86" Normal YTD- 6.27"
Wettest YTD Total In 1941- 19.76"
Driest YTD Total In 1907- .26"
(1900 - 2017)
YTD- 4.98" Normal YTD- 6.71"
Wettest YTD Total In 1941- 21.41"
Driest YTD Total In 1900- .50"
Carlsbad, NM Airport.
(1930 - 2017)
(1930 - 2017)
YTD- 3.24" Normal YTD- 6.84"
Wettest YTD Total In 1992- 13.80"
Driest YTD Total In 2011- .09"
Hobbs, NM.
(1913 - 2017)
(1913 - 2017)
YTD- 4.21" Normal YTD- 9.91"
Wettest YTD Total In 1992- 22.08"
(1919 - 2017)
YTD- 3.68" Normal YTD- 8.93"
Wettest YTD Total In 1941- 23.88"
Driest YTD Total In 1928- .61"
Elk, NM.
(1895 - 2017)
(1895 - 2017)
YTD- 7.73" Normal YTD- 7.93"
Wettest YTD Total In 1905- 27.81"
Driest YTD Total In 1910- Trace
The Truth Is Stranger Than Fiction!


Comments
Post a Comment
Your comments, questions, and feedback on this post/web page are welcome.