My Current Weather

Sunday, February 21, 2021

February 12-19, 2021 Historic Winter Storm Summary #2.

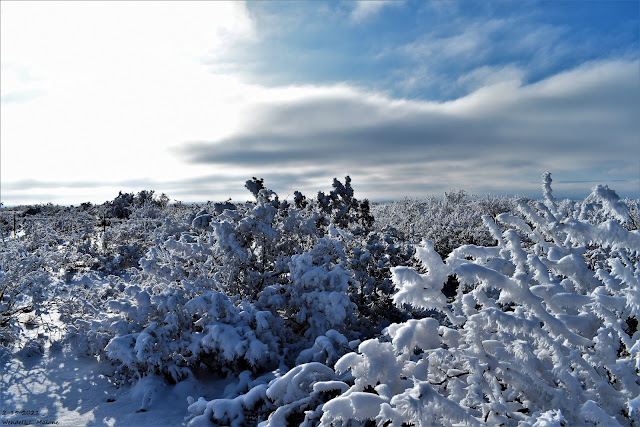
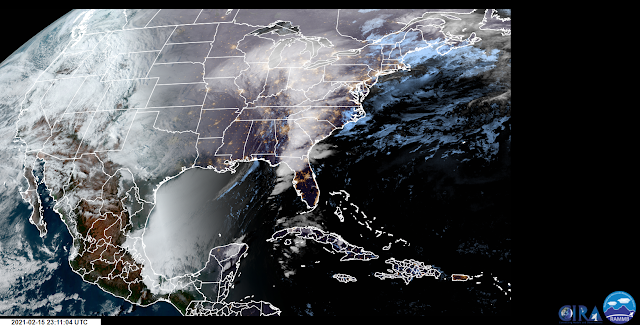
February 15, 2021.
Frozen Landscape Southwest Of Whites City.

Once In A Lifetime Storm For Texas?

Although this sounds a bit extreme I may not be far off with this statement. The jury is still out on the final verdict...it may take some time for all of the data to be gathered and summarized. Nevertheless this event no doubt was historic, especially for Texas. Not so much for New Mexico. A lot of comparisons to the brutal February 1899 arctic outbreak have been made.

Review Of The Brutal Cold Of February 1899.

Let's look back in time at the coldest most widespread winter event in U.S. history (not including our current February outbreak). 


The “Great Arctic Outbreak of February 1899” as it became known, is one of the most widespread North American cold snaps in recorded history. It was described in a 1988 academic article as “a benchmark with which to compare similar events.”

Temp change between 1780 (a year of normal solar activity) and 1680 (a year within the depths of the Maunder Minimum) — NASA


The amount of magnetic flux that rises up to the Sun’s surface varies within a solar cycle. Near the minimum of the cycle, it is rare to see sunspots on the Sun, and the spots that do appear are very small and short-lived. During the maximum, there are many sunspots visible.

The strength of each cycle overall also varies.

The “Great Arctic Outbreak of February 1899” occurred during the solar minimum between ‘weak’ solar cycles 13 and 14 — these were the previous comparably weak cycles to the one we’ve just experienced, cycle 24.

There's Cold - And Then There Was February 1899.

Snow weighed down the fronds of palm trees of Fort Myers, Florida, while an icy crust formed on the Mississippi River in New Orleans. Nearly three feet of snow buried the nation’s capital and ice-encased steamboats on Lake Michigan. There’s cold—and then there was the Great Arctic Outbreak of February 1899. 

The polar vortex delivered an icy slap to every corner of the continental United States, making all other Snowmageddons to follow seem mild by comparison.

The bitter cold first hit the West Coast in the first days of February as temperatures reached lows of 33 degrees Fahrenheit in San Diego and 12 degrees in Seattle. The frigid air then barreled east with freezing temperatures reaching as far south as the Gulf Coast and Florida Panhandle.

On February 11, residents of Fort Logan, Montana, awoke to a temperature of -61 degrees. Wind chills in southern Texas were estimated at -25 to -40 degrees, downright balmy compared to the wind chills approaching -100 degrees on the northern Plains. Between February 11 and February 14, the Great Arctic Outbreak set record low temperatures that still stand in Grand Rapids (-24 degrees), Wichita (-22 degrees), Oklahoma City (-17 degrees), Atlanta (-9 degrees), Fort Worth (-8 degrees) and Baton Rouge (2 degrees).

Even in Florida, there was no vacation from the cold. The temperature in Tallahassee fell to an all-time state record of -2 degrees on February 13 as nearly two inches of snow fell from the Panhandle to Jacksonville. Tampa received the first measurable snowfall recorded in the city’s history and trace amounts fell further down the Gulf Coast. Even in tropical Miami, the mercury dipped below freezing as desperate farmers set fires among their orange groves and wrapped their trees for protection from the cold.

No amount of snow, though, could keep the Mardi Gras revelers in New Orleans from making their appointed rounds. The day after temperatures hit an all-time low of 7 degrees and as ice flowed down the Mississippi River into the Gulf of Mexico, the traditional carnival and Rex parade went on as scheduled through the streets of New Orleans.

Early Summary & Data Of The February 2021 Polar Outbreak.

(February 2021).

(February 1st - 20th, 2021).


(February 2011).


As far as actual overnight low temperatures go this February's polar outbreak (2021) was nowhere as cold in New Mexico as the February 2011 outbreak. The sheer number of below zero low temperatures recorded during the 2011 event was amazing. It was colder in the Tularosa Basin (Alamagordo area) than it was in the Pecos Valley of Southeastern New Mexico. 

(February 1899).


Note that there were very few National Weather Service Climate Co-Op Stations in New Mexico in 1899. So we have a limited view of that record cold outbreak.


New Mexico tentatively has recorded 95 new daily record low "high" temperatures that were tied or broken during February 2021 as of the 21st. Mostly during this historic cold outbreak.

77 new daily record low temperatures were either tied or broken during this month, mostly during this historic cold outbreak.23 new daily record snowfall records were tied or broken.19 new daily record snowfall depths were tied or broken.

4 new monthly record low "high" temperatures that were tied or broken. 0 new monthly low temperatures were recorded. 0 new monthly snowfall records were tied or broken. 0 new monthly snow depth records were tied or broken. 

1 all-time new low "high" temperature was tied. 0 new all-time snowfall records were tied or broken. 0 new all-time snow depth records were tied or broken. 


Texas tentatively has recorded 798 new daily record low "high" temperatures that were tied or broken during February 2021 as of the 21st.

610 new daily record low temperatures were either tied or broken during this month, mostly during this historic cold outbreak.147 new daily record snowfall records were tied or broken. 244 new daily record snowfall depths were tied or broken.

93 new monthly record low "high" temperatures were either tied or broken during this month, mostly during this historic cold outbreak. 124 new daily record low temperatures were either tied or broken during this month. 19 new monthly snowfall records were tied or broken. 37 new monthly record snowfall depths were tied or broken.

54 new daily all-time record lows were tied or broken. 32 new all-time record low temperatures were either tied or broken during this month, mostly during this historic cold outbreak. 9 new all-time record snowfall records were tied or broken. 16 all-time record snowfall depths were tied or broken.

These records are preliminary and are subject to change as additional data comes in.

Summary.


As for New Mexico, especially the Southeastern Plains and nearby locals this recent event was definitely cold, but overall it falls short of other historic record cold outbreaks such as 1895, 1899, 1903, 1905, 1909, 1913, 1918, 1933, 1948, 1949, 1951, 1953, 1962, 1963, 1966, 1971, 1976, 1978, 1979, 1983, 1985, 1989, 1997, and 2011.


On February 12th, 1905 Roswell officially plunged down to -29ĀŗF to establish its all-time record low temperature. Public reports indicated that temperatures fell as low as -35ĀŗF and colder in areas near the Pecos River and outside of town. The same happened in Artesia on February 8th, 1933 when in town the town fell to -35ĀŗF officially. Outside of town farmers reported temperatures as low as -43ĀŗF that morning near the Pecos River.

This recent historic record cold event (especially in Texas) was just another reminder that 'yes" it does get colder than most people realize who live in this area. Most conservations I've had over the recent years with anyone under 50 indicates that the majority have no clue that it has been this cold here before. 

I warned people a week in advance that this event would be historic, and full of surprises. Indeed it was...especially across Texas. Our surprise was that the cold was not as widespread and brutal in New Mexico as past events have been. 

History, weather, and climate are cyclic and repeat themselves. More extreme cold events (worse than this one) will in time occur again. Looking at our local climate trends it is very apparent to me that we are returning to a colder, stormier trend in our local climate.

I posted on my Facebook Page- "For those of you who think this past week's winter weather was unusual. Sorry. Now you understand what we grew up with." We have a whole generation of people who are growing up and moving into Southeastern New Mexico, who are clueless about our local extremes. Particularly our winter extremes when it comes to winter cold and snow.

Texas suffered extreme power outages. At one time (during the height of the past cold week) there were over 7 million customers without power. No doubt there has to be many Texans who are royally ticked off at the situation. Mentioning solar power and wind turbine driven electric power does not sit well with them at the moment. Can you blame them?

Thankfully in New Mexico, our outages were nothing in comparison. A State of Civil Emergency was declared in New Mexico in December 2015 due to the deep snows and snowdrifts and the rescues that were needed. The same thing also happened in February 2011 due to the extreme cold. As well as during the three-day blizzard during Christmas week in 1997. 


 To give even more perspective on just how prolonged this arctic outbreak was, here are the 7-day average temperatures (at or below 32F) from February 11-17. pic.twitter.com/uLpmhYa9MM

The Truth Is Stranger Than Fiction!

Saturday, February 20, 2021

Junk Grade Models: Even Short-Term Climate And Weather Modelers Get It All Wrong!


Junk Grade Models: Even Short-Term Climate And Weather Modelers Get It All Wrong!


Many climate policies are based on scenarios generated by models. Depending on what these models churn out, actions and costly regulations get enacted to mitigate the worst consequences. So we hope that the modelers get it right. Unfortunately, they are still shooting in the dark. Even short-term models are failing miserably.

TWC  forecast a basket case.

It turns out most models are junk grade when it comes to forecast quality. For example, The Weather Channel here not long ago issued it’s winter outlook up through March:

The area of the US now being hit by one of the most vicious cold waves in the last 100 years was indeed forecast to be “way above normal” or “much above normal”. So far the exact opposite has happened. They never saw it coming.

We have to wonder what it takes to be issued a license to practice weather forecasting nowadays, and we have to feel sorry for those businesses and industries that relied on these botched forecasts.

Yet, these are the type of outlooks that policymakers insist we need to heed and so take immediate (costly) action.

Read the rest of the article via the link above.

The Truth Is Stranger Than Fiction!

Friday, February 19, 2021

February 12-19, 2021 Historic Winter Storm Summary #1.


4:04 AM MST.
Monday, Feb15, 2021.

(4 AM MST Monday, Feb 15, 2021).


Brutal Cold Plunges Into The Gulf Of Mexico.

Take a close look at the Geo Color Satellite image at the top of the page. Notice that status clouds had covered nearly the entire Gulf of Mexico as the brutal polar airmass plunged deep into the Gulf. Temperatures at 4 AM MST had fallen below freezing with apparent temperatures down into the upper teens! I would have loved to have been aboard a commercial airliner flying over this cloud deck at 35,000' and looking down on it. That would have been a beautiful sight to behold for sure. 

This Weeklong Event Was Historic. 

It is going to take awhile for all of the records that were smashed by this historic long-duration polar outbreak to be complied. Widespread record cold sent the region into the deep freeze for more than a week in many nearby areas. Although most locations in Texas did not break the "Coldest Night In Texas" all-time record lows set back on February 12, 1899...some did and others were close. Midland rose above freezing for the first time today in the past 91/2 days. Just incredible.

Thankfully in New Mexico, we did not get nearly as cold as the brutal Polar outbreak of February 2011. Or January 1962 and February 8, 1933. Years with low temperatures below 0ĀŗF in Southeastern New Mexico. This Polar invasion was bad but not nearly as bad as years past. 

Not only was the cold remarkable (especially the duration and many days in a row below freezing) so was the snowfall in Texas. In New Mexico not so much. It's been much colder in New Mexico including Southeastern New Mexico. Our local storm total snowfall totals came nowhere close to the Blizzard of December 2015 but our snow did add to the misery. More on this later when the data becomes available.

(As Of 5 AM MST Friday, Feb 19, 2021).


National Snow Depth Coverage Map.
(At 6 AM MST Friday, Feb 19, 2021).


(Storm Snowfall Totals Of 6" and Greater).
(Feb 12 -19, 2021).


(Feb 12 -19, 2021).


Texas CoCoRaHS Reported Snowfall Totals.
(Storm Snowfall Totals Of 6" and Greater).
(Feb 12 -19, 2021).


• 11 ENE RED RIVER - 17.0 in.

 • 1 N SANTA FE - 14.5 in.
 •  SANTA FE - 14.3 in.
 • 8 SE EAGLE NEST - 14.0 in.
 • 11 ENE AMALIA - 14.0 in.
 • 7 ESE CHUPADERO - 14.0 in.
 • 5 SSE SANTA FE - 13.3 in.
 • 3 SW SANTA FE - 13.0 in.
 • 5 SSE LLANO LARGO - 13.0 in.
 • 6 SSE SANTA FE - 12.8 in.
 • 1 E SANTA FE - 12.2 in.
 •  PIETOWN - 12.1 in.
 • 8 SSW RED RIVER - 12.0 in.
 • 2 NE SANTA FE - 12.0 in.

 • 9 ENE SHADY BROOK - 11.0 in.
 • 2 W CAPITAN - 11.0 in.
 • 5 SSW TOADLENA - 11.0 in.
 • 1 W PONDEROSA - 11.0 in.
 • 2 E SAN PABLO - 10.3 in.
 • 2 SW SANTA FE - 10.0 in.
 • 8 SW ROCIADA - 10.0 in.
 • 2 SE SANTA FE - 10.0 in.
 • 5 SE SANTA FE - 10.0 in.
 • 1 WSW SANTA FE - 10.0 in.

 • 6 SSE SANTA FE - 9.8 in.
 • 1 N SANTA FE - 9.0 in.
 • 3 NW TRES RITOS - 9.0 in.
 •  TRES RITOS - 9.0 in.
 • 3 N SANTA FE - 9.0 in.
 • 8 NE ARROYO SECO - 9.0 in.
 • 7 ESE CUBA - 9.0 in.

 •  TESUQUE - 8.0 in.
 • 1 SE SANTA FE - 8.0 in.
 • 3 NNW LAMY - 8.0 in.
 •  SANTA FE - 8.0 in.
 • 8 NNW GLORIETA - 8.0 in.
 • 2 SW PECOS - 8.0 in.
 • 9 E CUBA - 8.0 in.
 •  VALDEZ - 8.0 in.

 • 1 N AGUA FRIA - 7.7 in.
 •  TAOS - 7.5 in.
 •  ANGEL FIRE - 7.5 in.
 • 4 SW SANTA FE - 7.5 in.
 • 4 N AGUA FRIA - 7.4 in.
 • 5 NE ALTO - 7.3 in.
 • 4 NNW LAMY - 7.2 in.
 • 5 ESE BLACK LAKE - 7.2 in.
 • 5 E EL MORRO - 7.0 in.
 • 3 ESE ANGEL FIRE - 7.0 in.
 • 1 NW OCATE - 7.0 in.
 • 5 SW BONITO LAKE - 7.0 in.
 • 4 NNW TRES RITOS - 7.0 in.
 • 3 NE RUIDOSO - 7.0 in.
 • 5 E SHADY BROOK - 7.0 in.
 • 13 ESE CUBA - 7.0 in.
 • 3 WNW SANTA FE - 7.0 in.

 •  SANTA FE - 6.5 in.
 • 2 NW RIBERA - 6.3 in.
 • 4 NW SANTA FE - 6.2 in.
 • 5 NW CANONES - 6.1 in.
 •  LAMY - 6.0 in.
 • 3 ENE PONDEROSA - 6.0 in.
 • 1 NE BLOOMFIELD - 6.0 in.
 •  RED RIVER - 6.0 in.
 • 3 SW LLANO - 6.0 in.
 • 1 NNW CEDAR CREST - 6.0 in.
 • 2 WSW EL MORRO - 6.0 in.

 • 2 ENE TAOS - 5.9 in.
 • 3 NNW LAMY - 5.8 in.
 • 5 ESE BLACK LAKE - 5.8 in.
 •  SANDIA PARK - 5.8 in.
 • 3 E MEADOW LAKE - 5.8 in.
 • 2 NW CARNUEL - 5.6 in.
 • 3 NE FARMINGTON - 5.5 in.
 • 1 ESE SEDILLO - 5.5 in.
 • 2 WSW HERNANDEZ - 5.5 in.
 • 2 NNE ROWE - 5.5 in.
 •  JACONITA - 5.5 in.
 • 1 E AZTEC - 5.3 in.
 • 12 SSW VERMEJO PARK - 5.2 in.
 • 2 SSW LOS CORDOVAS - 5.1 in.
 • 2 W PONDEROSA - 5.1 in.
 • 4 W MOUNTAINAIR - 5.0 in.
 • 28 WNW RATON CREWS AIRPORT - 5.0 in.
 • 12 SSE COYOTE - 5.0 in.
 •  AZTEC - 5.0 in.
 • 2 SE AGUA FRIA - 5.0 in.
 •  POJOAQUE - 5.0 in.
 • 7 E CANJILON - 5.0 in.
 •  BLOOMFIELD - 5.0 in.
 • 1 ESE AZTEC - 5.0 in.
 • 6 W LOS ALAMOS - 5.0 in.
 • 6 SSE LUNA - 5.0 in.
 •  EAGLE NEST - 5.0 in.

 • 5 NW LAMY - 4.9 in.
 • 4 SSW FLORA VISTA - 4.5 in.
 • 1 N RUIDOSO - 4.5 in.
 • 2 NNE ESPANOLA - 4.5 in.
 • 1 N CANONES - 4.5 in.
 • 3 NW CARNUEL - 4.5 in.
 • 1 WNW RED RIVER - 4.5 in.
 • 2 SE MANZANO - 4.5 in.
 • 1 ESE TRUCHAS - 4.4 in.
 • 2 W DATIL - 4.3 in.
 • 4 NW LAMY - 4.3 in.
 • 1 ESE POJOAQUE PUEBLO - 4.0 in.
 • 4 NW SANDIA PARK - 4.0 in.
 • 6 NNW CARNUEL - 4.0 in.
 • 2 E GLORIETA - 4.0 in.
 • 5 E AZTEC - 4.0 in.
 •  CROWNPOINT - 4.0 in.
 • 3 NNE LOS CERRILLOS - 4.0 in.
 •  FARMINGTON - 4.0 in.
 • 1 NE AGUA FRIA - 4.0 in.
 • 2 SE ALTO - 4.0 in.
 • 1 WSW PONDEROSA - 4.0 in.

 • 7 WNW CANONCITO - 3.7 in.
 • 1 WSW FARMINGTON - 3.6 in.
 • 1 S CEDAR HILL - 3.6 in.
 • 9 NE ALBUQUERQUE - 3.5 in.
 • 5 WSW ARROYO HONDO - 3.5 in.
 • 1 WSW SEDILLO - 3.5 in.
 • 3 NE BONITO LAKE - 3.5 in.
 • 3 SSW FARMINGTON - 3.5 in.
 •  CHAMA - 3.5 in.
 • 1 WNW EL RANCHO - 3.5 in.
 • 15 NW ALBUQUERQUE - 3.5 in.
 • 1 S SEDILLO - 3.5 in.
 • 1 WSW LOS ALAMOS - 3.5 in.
 • 3 SSE MAGDALENA - 3.4 in.
 • 2 SW MIERA - 3.4 in.
 • 1 SW GALLUP - 3.3 in.
 • 1 WNW LAMY - 3.1 in.
 • 2 WNW MINERAL HILL - 3.0 in.
 • 8 SSW SAN MIGUEL - 3.0 in.
 • 3 E LOS ALAMOS - 3.0 in.
 • 3 S FARMINGTON - 3.0 in.
 • 6 NW CARNUEL - 3.0 in.
 • 2 NE SAN ANTONITO - 3.0 in.
 • 1 SSE SEDILLO - 3.0 in.
 •  CANJILON - 3.0 in.
 • 5 WNW LOS ALAMOS - 3.0 in.
 • 4 W MOUNTAINAIR - 3.0 in.
 • 6 ENE ALBUQUERQUE - 3.0 in.
 • 1 ENE SANTA CRUZ - 3.0 in.

 • 1 ENE ALTO - 2.8 in.
 • 4 NW CARNUEL - 2.8 in.
 • 2 NE CHACON - 2.6 in.
 • 1 N MORIARTY - 2.6 in.
 • 5 NNW CARNUEL - 2.6 in.
 • 1 WNW WHITE ROCK - 2.6 in.
 • 5 ENE SANTA CRUZ - 2.5 in.
 • 3 ENE SANTA FE - 2.5 in.
 • 2 ENE GALLUP - 2.5 in.
 • 4 NE SANTA FE - 2.5 in.
 • 2 SE SOUTH SAN YSIDRO - 2.5 in.
 • 8 ESE ALBUQUERQUE - 2.5 in.
 • 4 SSE ALBUQUERQUE - 2.5 in.
 • 8 E ALBUQUERQUE - 2.5 in.
 •  RIO COMMUNITIES - 2.5 in.
 • 5 ENE LOS CERRILLOS - 2.4 in.
 • 3 N CHILILI - 2.4 in.
 • 1 ESE CEDAR HILL - 2.3 in.
 • 2 S VALENCIA - 2.3 in.
 • 1 SSE GALLUP - 2.3 in.
 • 1 N RATON - 2.3 in.
 • 6 SSE SANTA FE - 2.3 in.
 • 1 E VALENCIA - 2.1 in.
 • 6 SE RIO COMMUNITIES - 2.1 in.
 • 5 NE ALBUQUERQUE - 2.0 in.
 • 6 WNW TERERRO - 2.0 in.
 • 2 W ANGUS - 2.0 in.
 •  GALLUP - 2.0 in.
 • 2 NW EDGEWOOD - 2.0 in.
 • 2 NE PLACITAS - 2.0 in.
 • 5 E ALBUQUERQUE - 2.0 in.
 • 8 NNW CARNUEL - 2.0 in.
 • 1 S SANTA FE - 2.0 in.
 • 6 ESE MOGOLLON - 2.0 in.
 • 1 SSW MADRID - 2.0 in.
 • 2 E SAN ANTONITO - 2.0 in.
 • 3 WSW CARNUEL - 2.0 in.
 • 11 NNW CANON PLAZA - 2.0 in.

 • 5 W CARNUEL - 1.8 in.
 • 2 SSW VALENCIA - 1.8 in.
 •  SAN ANTONIO - 1.8 in.
 • 5 E ALBUQUERQUE - 1.8 in.
 • 1 S PERALTA - 1.7 in.
 • 3 ESE ALBUQUERQUE - 1.6 in.
 • 2 SE ALBUQUERQUE - 1.5 in.
 • 7 ESE KENNA - 1.5 in.
 • 8 W MCINTOSH - 1.5 in.
 • 3 ESE MIERA - 1.5 in.
 • 5 NNW CARNUEL - 1.5 in.
 • 1 E SOCORRO - 1.5 in.
 • 1 SSE WHITE ROCK - 1.5 in.
 • 1 ENE SANTA FE - 1.5 in.
 • 5 ESE ALBUQUERQUE - 1.5 in.
 •  CORDOVA - 1.5 in.
 • 1 SSW SAN ANTONIO - 1.5 in.
 • 7 NNW AGUA FRIA - 1.5 in.
 • 5 S ALBUQUERQUE - 1.4 in.
 • 2 NE SOCORRO - 1.4 in.
 • 4 W ALBUQUERQUE - 1.4 in.
 • 1 SSE ESCONDIDA - 1.4 in.
 • 4 NW ALBUQUERQUE - 1.3 in.
 • 4 S LOS CERILLOS - 1.3 in.
 • 14 NW MILAN - 1.3 in.
 • 7 W SANDIA PARK - 1.3 in.
 • 8 W SANDIA PARK - 1.3 in.
 • 2 E ALBUQUERQUE - 1.3 in.
 • 4 WSW RIO RANCHO - 1.2 in.
 • 1 NNE CORRALES - 1.2 in.
 • 3 WNW ALBUQUERQUE - 1.1 in.
 • 3 W ALBUQUERQUE - 1.1 in.
 • 12 NNW JEMEZ SPRINGS - 1.0 in.
 • 5 WNW ALBUQUERQUE - 1.0 in.
 • 2 SSW SANTA ANA PUEBLO - 1.0 in.
 •  DULCE - 1.0 in.
 • 1 SSW CHAMIZAL - 1.0 in.
 • 3 W RIO RANCHO - 1.0 in.
 • 1 SSW MORIARTY - 1.0 in.
 • 6 NW EDGEWOOD - 1.0 in.
 • 1 SSE ALBUQUERQUE - 1.0 in.
 • 1 WSW SPRINGER - 1.0 in.
 • 3 NNE ALBUQUERQUE - 1.0 in.
 • 5 NNW CARNUEL - 1.0 in.

 • 5 NW ALBUQUERQUE - 0.9 in.
 • 5 NNW ALBUQUERQUE - 0.9 in.
 • 2 NNE ROSWELL - 0.9 in.
 • 6 NNW ALBUQUERQUE - 0.9 in.
 • 1 WSW MIAMI - 0.9 in.
 • 1 W SANTA FE - 0.8 in.
 • 3 NW SANDIA PUEBLO - 0.8 in.
 • 4 NNW ISLETA PUEBLO - 0.8 in.
 • 3 SW RIO RANCHO - 0.8 in.
 • 1 SW SANTA FE - 0.8 in.
 • 2 NNW EDGEWOOD - 0.8 in.
 • 1 SSW LA MADERA - 0.8 in.
 • 4 E ALBUQUERQUE - 0.8 in.
 • 4 NE ALBUQUERQUE - 0.8 in.
 • 8 NW ALBUQUERQUE - 0.8 in.
 • 5 NNW CARNUEL - 0.8 in.
 • 3 NNW ISLETA PUEBLO - 0.7 in.
 • 9 NW ALBUQUERQUE - 0.7 in.
 • 1 W GRANTS - 0.7 in.
 • 3 WSW CORRALES - 0.7 in.
 • 8 WNW ALBUQUERQUE - 0.7 in.
 • 6 NNW ROSWELL - 0.7 in.
 • 5 N ALBUQUERQUE - 0.7 in.
 • 1 E RIO RANCHO - 0.7 in.
 • 1 ENE RIO RANCHO - 0.6 in.
 • 1 WSW AGUA FRIA - 0.5 in.
 • 1 NNW PLACITAS - 0.5 in.
 • 3 WNW BERNALILLO - 0.5 in.
 • 5 WNW BERNALILLO - 0.5 in.
 • 1 ENE CORRALES - 0.5 in.
 • 6 NNW ALBUQUERQUE - 0.5 in.
 • 6 NW ALBUQUERQUE - 0.5 in.
 • 4 WNW RIO RANCHO - 0.5 in.
 • 2 SSW RUIDOSO - 0.4 in.
 • 1 WSW BERNALILLO - 0.4 in.
 • 3 N MILAN - 0.4 in.
 • 2 NW EL RITO - 0.4 in.
 • 5 W ALBUQUERQUE - 0.3 in.
 • 1 NW CORRALES - 0.3 in.
 • 2 SSW ARABELA - 0.2 in.
 • 2 SSE PERALTA - 0.2 in.
 • 2 WNW CLOVIS - 0.2 in.
Last updated:
0110 PM 02/18/20

The Truth Is Stranger Than Fiction!

NWS Albuquerque Burn Scar Matrix Forecast

Current NWS Watches/Warnings In Effect

New Mexico

Eddy County

Chaves County Plains & Mtn's

Culberson County

Lea County

Lincoln County

Otero County

Current US Temps

Current US Wind Chill/Heat Index Temperatures

NWS Midland Forecast

NWS Albuquerque Forecast

NWS Albuquerque Forecast

NWS El Paso Forecast

NWS Lubbock Forecast

NWS Lubbock Forecast

Average Daily High/Low Temperatures & Rainfall

Average Daily High/Low Temperatures & Rainfall