Posts

Showing posts from August, 2021

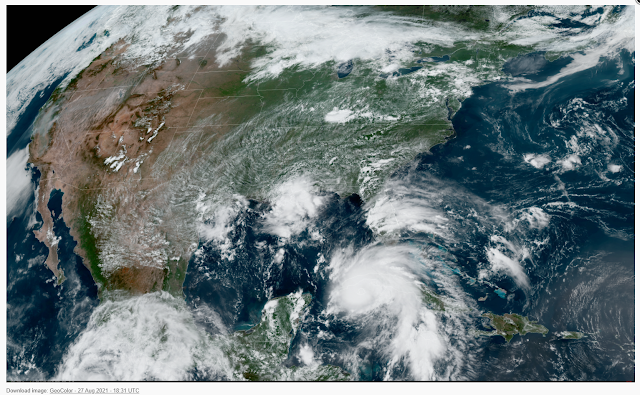
Cat 4 Ida Makes Landfall Near Port Fourchon, Louisiana.

Image
GRLevel3 Images Of Hurricane Ida At Landfall. Satellite Images Of Hurricane Ida At Landfall. Cat 4 Ida Makes Landfall. Hurricane Ida Tropical Cyclone Update NWS National Hurricane Center Miami FL AL092021 1155 AM CDT Sun Aug 29 2021 ...EXTREMELY DANGEROUS CATEGORY 4 HURRICANE IDA MAKES LANDFALL NEAR PORT FOURCHON LOUISIANA... NOAA Doppler radar imagery indicates that the eye of Ida made landfall along the southeastern coast of Louisiana near Port Fourchon around 1155 AM CDT (1655 UTC). Data from an Air Force Reserve reconnaissance aircraft and Doppler radar data indicate that Ida's maximum sustained winds at landfall were estimated to be 150 mph (240 km/h). The latest minimum central pressure estimated from reconnaissance aircraft data is 930 mb (27.46 in). Within the past hour, sustained winds of 43 mph (69 km/h) and a gust to 67 mph (107 km/h) were reported at Lakefront Airport in New Orleans. A NOAA National Ocean Service tide gauge in Shell Beach, Louisian

Cat 4 Hurricane Ida 40 Miles South Of Grand Isle, Louisiana.

Image
Sattilite Images Of Hurricane Ida.  Cat 4 Hurricane Ida. A local TV Station in New Orleans (Fox 8) is reporting an unofficial wind gust of 166 mph from an automated station offshore south of the mouth of the Mississippi River. This has not been confirmed as of 8:35 AM MDT this Sunday morning.  Sadly local media sources are reporting that many people in the New Orleans area and surrounding communities refused to evacuate. Many are praying that we are not fixing to see another Katrina or worse.  Hurricane Ida Tropical Cyclone Update NWS National Hurricane Center Miami FL AL092021 900 AM CDT Sun Aug 29 2021 ...900 AM CDT POSITION UPDATE... ...NORTHERN EYEWALL OF IDA APPROACHING THE COAST OF SOUTHEASTERN LOUISIANA... An elevated NOAA C-MAN station at Southwest Pass, Louisiana, recently reported a sustained wind of 102 mph (165 km/h) and a wind gust of 116 mph (187 km/h). Another elevated NOAA C-MAN station at Pilot's Station East near Southwest Pass recently reported a

Hurricane Ida Headed For Louisiana?

Image
GeoColor Satellite Image. 12:31 PM MDT Friday, August 27, 2021. RGB Sandwich Satellite Image. 12:31 PM MDT Friday, August 27, 2021. BULLETIN Hurricane Ida Intermediate Advisory Number 5A NWS National Hurricane Center Miami FL AL092021 200 PM EDT Fri Aug 27 2021 ...IDA MAKES LANDFALL AS A HURRICANE ON THE ISLE OF YOUTH... SUMMARY OF 200 PM EDT...1800 UTC...INFORMATION ---------------------------------------------- LOCATION...21.6N 82.7W ABOUT 5 MI...10 KM E OF THE CENTER OF THE ISLE OF YOUTH ABOUT 145 MI...245 KM E OF THE WESTERN TIP OF CUBA MAXIMUM SUSTAINED WINDS...75 MPH...120 KM/H PRESENT MOVEMENT...NW OR 325 DEGREES AT 15 MPH...24 KM/H MINIMUM CENTRAL PRESSURE...987 MB...29.15 INCHES. National Hurricane Center Updates. NHC Forecast Track. 9 AM MDT Advisory. Computer Model Ensemble Forecasts. GEFS EPS. ATCF. SFWMD. Hurricane Ida strengthened from a Tropical Depression yesterday to a Category 1 Hurricane this morning. This morning's model forecast tracks indicate that

Hurricane Threat In The Gulf Of Mexico Early Next Week?

Image
August 14, 2021. Rio Penasco River. Flash Flooding At Mile Marker #51. August 14, 2021. Rio Penasco River. Flash Flooding At Mile Marker #51. This area is normally dry and is not the main channel of the river. The river runs up against the hill in the background and is usually only a foot or so deep, and less than 10 feet wide. The Penasco had overflowed its banks and flooded the pasture area in the photo. At one point earlier in the morning it had overflowed up on US Hwy 82 for a brief time. Gulf Hurricane Threat. An area of disturbed weather is indicated on the map above by the orange x circled in red. This denotes the location of thunderstorms that will likely become a Tropical Storm in the Gulf of Mexico by late Sunday or Monday. Wind shear in the open Gulf is forecast to be low and very warm water temperatures will aid in the development of a Hurricane next week. Infrared Satellite Image. Valid At 2 PM MDT Wednesday, August 25, 2021. South Florida Water Management District. Model

Regional Year-To-Date Rainfall Totals.

Image
August 14, 2021. Runyan Ranches Mile Marker #56. Flash Flooding On The Rio Penasco. Reported Year-To-Date Rainfall Totals. Regional Totals. New Mexico CoCoRaHS Reported Rainfall Totals. This is a limited summary of the region's yearly rainfall totals (January 1st - August 18, 2021). Some of these totals may not represent the latest up-to-date data available. A CoCoRaHS volunteer rainfall observer located 2.8 miles west-northwest of Mayhill (Otero County) leads the state with a rainfall total so far of 26.32". Here on the Southeastern plains, the Hope NWS Climate Co-Op Station is the wettest so far this year with 23.59".  The Truth Is Stranger Than Fiction!

Current Watches In Effect

Storm Prediction Center (SPC) Day 1 Severe Weather Outlook

SPC Mesoscale Discussions

Current NWS National Watches/Warnings In Effect

Current NWS National Watches/Warnings In Effect
Click On The Map For The Latest Updates

New Mexico

NWS Regional Radar

NWS Regional Radar

GOES-East - Sector view: Southern Rockies - GEOColor

Current US Temps

Current US Wind Chill/Heat Index Temperatures

NWS Midland Radar

NWS Midland Regional Forecast

NWS Midland Regional Forecast

NWS Midland Regional Forecast

Cannon AFB Radar

NWS Albuquerque Radar

NWS Albuquerque Regional Forecast

NWS Albuquerque Regional Forecast

NWS Albuquerque Regional Forecast

NWS Albuquerque Regional Forecast

Holloman AFB Radar

NWS El Paso Radar

NWS El Paso Regional Forecast

NWS Lubbock Radar

NWS Lubbock Regional Forecast.

NWS Lubbock Regional Forecast

NWS Lubbock Regional Forecasts

NWS Lubbock Regional Forecast

NWS Forecast High Temps Today

NWS Forecast Low Temps Tonight

24-Hour Minimum Wind Chill Forecast

NWS Albuquerque Storm Total Snowfall Forecast

NWS Albuquerque Storm Total Rainfall Forecast

NWS Midland Storm Total Rainfall Forecast

NWS El Paso Storm Total Rainfall Forecast

Average Daily High/Low Temperatures & Rainfall

Average Daily High/Low Temperatures & Rainfall