


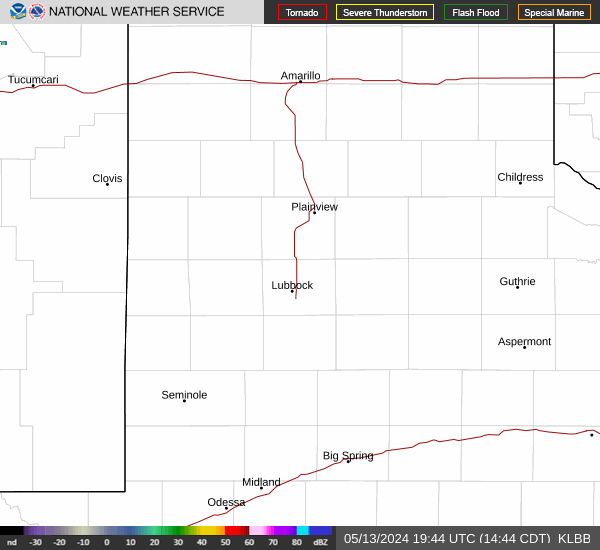
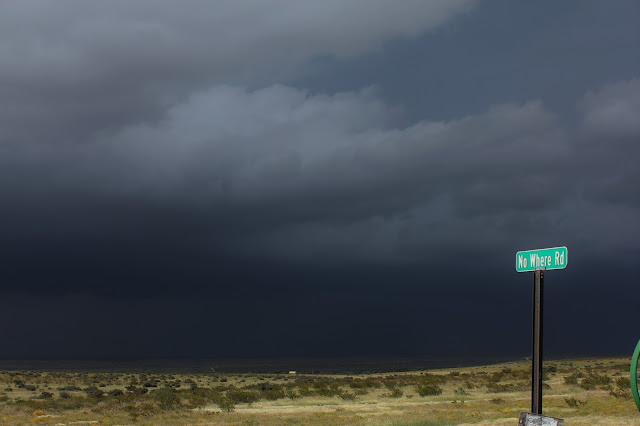
Little Ice Age - (1350 - 1850). Will It Happen Again In Our Lifetime?
Blog Updated @4:00 PM MST.

'First, the pace of global warming has been very moderate. The Little Ice Age, which ended a little over 100 years ago, brought the coldest temperatures of the past 10,000 years. The warming of the late 20th century has yet to return us to the temperature norms that predominated during most of the past 10,000 years. There has been no warming at all in the past 15 years."
My Opinion-
Without a doubt one of the most hotly contested debates there is centers around Anthropogenic Global Warming (AGW), or for politically correct reasons now...Global Climate Change.
I flat outright refuse (and always have) to believe that we humans can and do have this big of an impact on the planets climate. My opinion is that this controversy is politically driven and has nothing to do with real science. I believe that its the Political Far Lefts Agenda to change the Economic and Political structure in America...and one of their greatest tools has been this issue.
Many credible scientist around the world believe that we are headed towards another Little Ice Age. Sadly many meteorologists, climatologists, and scientists in America have chosen to promote and follow the AGW Agenda...when in reality there is ample evidence to the contrary.
This blog is in no way a complete work on this issue. This is a very limited publication on this subject and reflects my personal beliefs. Since I take the stand that its the Sun that is the biggest driver of the planets climate, then I offer the following snippets and articles to back my thinking. I also believe that the combination of Low Sunspot Cycles, Low Sun Irradiance, Cooling Of The Oceans, and Increased Volcanic Activity all combined to produce the Last Little Ice Age (1350-1850).
Our planet quit warming in 1998. As we continue to head deeper into the current Cold PDO phase of the Pacific Ocean, and see a further decline in sunspot activity, while we come out of one of the lowest sunspot cycles in recent memory, we will see colder winters ahead in my opinion.
It just makes sense to me that as the Sun dims, the Oceans Cool, and large Volcanic eruptions spew enormous amounts of Sulfur Dioxide into the earths upper atmosphere...then the planet will naturally cool. How soon? Some think the next Little Ice Age may already be beginning, and could last for the next 200-250 years.
One of my favorite books on this subject is:
The Russians (in my opinion) seem to have a better handle on what is going on.
Russian Scientists Say Period Of Global Cooling Ahead Due To Changes In The Sun.
I closely follow Anthony Watts Blog...Watts Up With That? Mr. Watts has dedicated an enormous amount of his time to discussing this subject with an open mind and objective opinion. Here are links to some of his past blogs-
Global Warming
Global Warming? No, Actually We're Cooling, Claim Scientists.
Global Warming? No, Actually We're Cooling, Claim Scientists.
"A leaked report to the UN Intergovernmental Panel on Climate Change (IPCC) seen by the Mail on Sunday, has led some scientists to claim that the world is heading for a period of cooling that will not end until the middle of this century.
If correct, it would contradict computer forecasts of imminent catastrophic warming. The news comes several years after predictions that the arctic would be ice-free by 2013.
Despite the original forecasts, major climate research centres now accept that there has been a “pause” in global warming since 1997.
The original predictions led to billions being invested in green measures to combat the effects of climate change.
The changing predictions have led to the UN's climate change's body holding a crisis meeting, it was reported, and the IPCC is due to report on the situation in October. A pre-summit meeting will be held later this month."
I am not a Meteorologist, nor am I a Climatologist. Nor do I believe that you have to have that level of education to understand this subject. Common sense will serve you well if you will use it.
(1350 -1850).

There is no consensus regarding the time when the Little Ice Age began,[10][11] although a series of events preceding the known climatic minima has often been referenced. In the thirteenth century, pack ice began advancing southwards in the North Atlantic, as did glaciers in Greenland. Anecdotal evidence suggests expanding glaciers almost worldwide. Based on radiocarbon dating of roughly 150 samples of dead plant material with roots intact, collected from beneath ice caps on Baffin Islandand Iceland, Miller et al. (2012)[12] state that cold summers and ice growth began abruptly between AD 1275 and 1300, followed by "a substantial intensification" from 1430 to 1455.[13]
In contrast, a climate reconstruction based on glacial length[14][15] shows no great variation from 1600 to 1850, though it shows strong retreat thereafter.
For this reason, any of several dates ranging over 400 years may indicate the beginning of the Little Ice Age:
- 1250 for when Atlantic pack ice began to grow
- 1275 to 1300 based on radiocarbon dating of plants killed by glaciation
- 1300 for when warm summers stopped being dependable in Northern Europe
- 1315 for the rains and Great Famine of 1315–1317
- 1550 for theorized beginning of worldwide glacial expansion
- 1650 for the first climatic minimum.
The Little Ice Age ended in the latter half of the nineteenth century or early in the twentieth century.[16][17][18]
The Little Ice Age brought colder winters to parts of Europe and North America. Farms and villages in the Swiss Alps were destroyed by encroaching glaciers during the mid-seventeenth century.[19] Canals and rivers in Great Britain and theNetherlands were frequently frozen deeply enough to support ice skating and winter festivals.[19] The first River Thames frost fair was in 1607 and the last in 1814; changes to the bridges and the addition of an embankment affected the river flow and depth, hence diminishing the possibility of freezes. Freezing of the Golden Horn and the southern section of the Bosphorus took place in 1622. In 1658, a Swedish army marched across the Great Belt to Denmark to attack Copenhagen. The winter of 1794-1795 was particularly harsh, when the French invasion army under Pichegru could march on the frozen rivers of the Netherlands, while the Dutch fleet was fixed in the ice in Den Helder harbour. In the winter of 1780, New York Harbor froze, allowing people to walk from Manhattan to Staten Island. Sea ice surrounding Iceland extended for miles in every direction, closing harbors to shipping.
The population of Iceland fell by half, but this was perhaps caused by fluorosis after the eruption of the volcano Laki in 1783.[20] Iceland also suffered failures of cereal crops, and people moved away from a grain-based diet.[21] The Norse colonies inGreenland starved and vanished (by the early fifteenth century), as crops failed and livestock could not be maintained through increasingly harsh winters, though Jared Diamond noted they had exceeded the agricultural carrying capacity before then. In North America, American Indians formed leagues in response to food shortages.[22] In Lisbon, Portugal, snowstorms were much more frequent than today. Heavy snowfalls in the winters of 1665, 1744 and 1886 were reported.[23]
Hubert Lamb said that in many years, "snowfall was much heavier than recorded before or since, and the snow lay on the ground for many months longer than it does today."[24] Many springs and summers were cold and wet, but with great variability between years and groups of years. Crop practices throughout Europe had to be altered to adapt to the shortened, less reliable growing season, and there were many years of dearth and famine (such as the Great Famine of 1315–1317, although this may have been before the LIA proper).[25] According to Elizabeth Ewan and Janay Nugent, "Famines in France 1693–94, Norway 1695–96 and Sweden 1696–97 claimed roughly 10% of the population of each country. In Estonia and Finland in 1696–97, losses have been estimated at a fifth and a third of the national populations, respectively."[26] Viticulture disappeared from some northern regions. Violent storms caused serious flooding and loss of life. Some of these resulted in permanent loss of large areas of land from the Danish, German and Dutch coasts.[24]
The extent of mountain glaciers had been mapped by the late nineteenth century. In both the north and the south temperate zones, snowlines (the boundaries separating zones of net accumulation from those of net ablation) were about 100 m lower than they were in 1975.[27] In Glacier National Park, the last episode of glacier advance came in the late 18th and early nineteenth centuries.[28] In Chesapeake Bay, Maryland, large temperature excursions were possibly related to changes in the strength of North Atlantic thermohaline circulation.[29]
In North America, the early European explorers and settlers reported exceptionally severe winters. For example, according to Lamb, Samuel Champlain reported bearing ice along the shores of Lake Superior in June 1608; both Europeans and indigenous peoples suffered excess mortality in Maine during the winter of 1607-1608; and extreme frost was reported in the Jamestown, Virginia settlement at the same time.[24] The journal of Pierre de Troyes, Chevalier de Troyes, who led an expedition to James Bay in 1686, recorded that James Bay was still littered with so much floating ice that he could hide behind it in his canoe on 1 July.[30]
Antonio Stradivari, the famous violin maker, produced his instruments during the Little Ice Age. The colder climate is proposed to have caused the wood used in his violins to be denser than in warmer periods, contributing to the tone of Stradivari's instruments.[31] According to the science historian James Burke the period inspired such innovations in everyday life as the widespread use of buttons and button holes, knitting of custom-made undergarments to better cover and insulate the human body, and installation of fireplace hoods to make more efficient use of fires for indoor heating,[32] as well as the development of the enclosed stove, in early versions often covered with ceramic tiles.
The Little Ice Age by anthropology professor Brian Fagan of the University of California at Santa Barbara tells of the plight of European peasants during the 1300 to 1850 chill: famines, hypothermia, bread riots, and the rise of despotic leaders brutalizing an increasingly dispirited peasantry. In the late seventeenth century, writes Fagan, agriculture had dropped off so dramatically, "Alpine villagers lived on bread made from ground nutshells mixed with barley and oat flour." [33] Historian Wolfgang Behringer has linked intensive witch-hunting episodes in Europe to agricultural failures during the Little Ice Age.[34]
Milankovitch theory describes the collective effects of changes in the Earth's movements upon its climate, named after Serbian geophysicist and astronomer Milutin Milanković, who worked on it during his internment as a First World War POW. Milanković mathematically theorized that variations in eccentricity, axial tilt, and precession of the Earth's orbit determined climatic patterns on Earth through orbital forcing.

Solar variation is the change in the amount of radiation emitted by the Sun (see Solar radiation) and in its spectral distribution over years to millennia. These variations have periodic components, the main one being the approximately 11-year solar cycle (or sunspot cycle). The changes also have aperiodic fluctuations.[1] In recent decades, solar activity has been measured by satellites, while before it was estimated using 'proxy' variables. Scientists studying climate change are interested in understanding the effects of variations in the total and spectral solar irradiance on Earth and its climate.
Variations in total solar irradiance were too small to detect with technology available before the satellite era, although the small fraction in ultra-violet light has recently been found to vary significantly more than previously thought over the course of a solar cycle.[2] Total solar output is now measured to vary (over the last three 11-year sunspot cycles) by approximately 0.1%,[3][4][5] or about 1.3 Watts per square meter (W/m2) peak-to-trough from solar maximum to solar minimum during the 11-year sunspot cycle. The amount of solar radiation received at the outer limits of Earth's atmosphere averages 1366 W/m2.[1][6][7] There are no direct measurements of the longer-term variation, and interpretations of proxy measures of variations differ. The intensity of solar radiation reaching Earth has been relatively constant through the last 2000 years, with variations estimated at around 0.1–0.2%.[8][9][10] Solar variation, together with volcanic activityare hypothesized to have contributed to climate change, for example during the Maunder Minimum. Changes in solar brightness are too weak to explain recent climate change.[11]
Sunspots are relatively dark areas on the radiating 'surface' (photosphere) of the Sun where intense magnetic activity inhibits convection and cools the photosphere. Faculae are slightly brighter areas that form around sunspot groups as the flow of energy to the photosphere is re-established and both the normal flow and the sunspot-blocked energy elevate the radiating 'surface' temperature. Scientists have speculated on possible relationships between sunspots and solar luminosity since the historical sunspot area record began in the 17th century.[21][22] Correlations are now known to exist with decreases in luminosity caused by sunspots (generally < - 0.3%) and increases (generally < + 0.05%) caused both by faculae that are associated with active regions as well as the magnetically active 'bright network'.[23]
Modulation of the solar luminosity by magnetically active regions was confirmed by satellite measurements of total solar irradiance (TSI) by the ACRIM1 experiment on the Solar Maximum Mission (launched in 1980).[23] The modulations were later confirmed in the results of the ERB experiment launched on the Nimbus 7 satellite in 1978,[24] and satellite observation of solar irradiance continues today with ACRIM-3 and other satellite measurements.[1]Sunspots in magnetically active regions are cooler and 'darker' than the average photosphere and cause temporary decreases in TSI of as much as 0.3%. Faculae in magnetically active regions are hotter and 'brighter' than the averagephotosphere and cause temporary increases in TSI.
The net effect during periods of enhanced solar magnetic activity is increased radiant output of the sun because faculae are larger and persist longer than sunspots. Conversely, periods of lower solar magnetic activity and fewer sunspots (such as the Maunder Minimum) may correlate with times of lower terrestrial irradiance from the sun.[25]
There had been some suggestion that variations in the solar diameter might also cause significant variations in output. But recent work, mostly from the Michelson Doppler Imager instrument on SOHO, shows these changes to be small, about 0.001%, much less than the effect of magnetic activity changes (Dziembowski et al., 2001).
Various studies have been made using sunspot number (for which records extend over hundreds of years) as a proxy for solar output (for which good records only extend for a few decades). Also, ground instruments have been calibrated by comparison with high-altitude and orbital instruments. Researchers have combined present readings and factors to adjust historical data. Other proxy data – such as the abundance of cosmogenic isotopes – have been used to infer solar magnetic activity and thus likely brightness. Sunspot activity has been measured using the Wolf number for about 300 years. This index (also known as the Zürich number) uses both the number of sunspots and the number of groups of sunspots to compensate for variations in measurement. A 2003 study by Ilya Usoskin of the University of Oulu, Finland found that sunspots had been more frequent since the 1940s than in the previous 1150 years.[26]

Sunspot numbers over the past 11,400 years have been reconstructed using carbon-14-based dendrochronology (tree ring dating). The level of solar activity during the past 70 years is exceptional – the last period of similar magnitude occurred around 9,000 years ago (during the warm Boreal period).[27][28] The Sun was at a similarly high level of magnetic activity for only ~10% of the past 11,400 years, and almost all of the earlier high-activity periods were shorter than the present episode.[28]
| Event | Start | End |
|---|---|---|
| Homeric minimum[29] | 950BC | 800BC |
| Oort minimum (see Medieval Warm Period) | 1040 | 1080 |
| Medieval maximum (see Medieval Warm Period) | 1100 | 1250 |
| Wolf minimum | 1280 | 1350 |
| Spörer Minimum | 1450 | 1550 |
| Maunder Minimum | 1645 | 1715 |
| Dalton Minimum | 1790 | 1820 |
| Modern Maximum | 1900 | present |
The solar cycle (or solar magnetic activity cycle) is the periodic change in the sun's activity (including changes in the levels of solar radiation and ejection of solar material) and appearance (visible in changes in the number of sunspots, flares, and other visible manifestations). Solar cycles have an average duration of about 11 years. They have been observed (by changes in the sun's appearance and by changes seen on Earth, such as auroras) for hundreds of years.
Solar variation causes changes in space weather, weather, and climate on Earth. It causes a periodic change in the amount of irradiation from the Sun that is experienced on Earth.
It is one component of solar variation, the other being aperiodic fluctuations.

Powered by a hydromagnetic dynamo process, driven by the inductive action of internal solar flows, the solar cycle:
- Structures the Sun's atmosphere, its corona and the wind;
- Modulates the solar irradiance;
- Modulates the flux of short-wavelength solar radiation, from ultraviolet to X-ray;
- Modulates the occurrence frequency of solar flares, coronal mass ejections, and other geoeffective solar eruptive phenomena;
- Indirectly modulates the flux of high-energy galactic cosmic rays entering the solar system.
The solar cycle was discovered in 1843 by Samuel Heinrich Schwabe, who after 17 years of observations noticed a periodic variation in the average number of sunspots seen from year to year on the solar disk. Rudolf Wolf compiled and studied these and other observations, reconstructing the cycle back to 1745, eventually pushing these reconstructions to the earliest observations of sunspots byGalileo and contemporaries in the early seventeenth century. Starting with Wolf, solar astronomers have found it useful to define a standard sunspot number index, which continues to be used today.
Until recently it was thought that there were 28 cycles in the 309 years between 1699 and 2008, giving an average length of 11.04 years, but recent research has showed that the longest of these (1784–1799) seems actually to have been two cycles,[1][2] so that the average length is only around 10.66 years. Cycles as short as 9 years and as long as 14 years have been observed, and in the double cycle of 1784-1799 one of the two component cycles had to be less than 8 years in length. Significant variations in amplitude also occur. Solar maximum and solar minimum refer respectively to epochs of maximum and minimum sunspot counts. Individual sunspot cycles are partitioned from one minimum to the next.
Following the numbering scheme established by Wolf, the 1755–1766 cycle is traditionally numbered "1". The period between 1645 and 1715, a time during which very few sunspots were observed, is a real feature, as opposed to an artifact due to missing data.[3] This epoch is now known as the Maunder minimum, after Edward Walter Maunder, who extensively researched this peculiar event, first noted by Gustav Spörer. In the second half of the nineteenth century it was also noted (independently) by Richard Carrington and by Spörer that as the cycle progresses, sunspots appear first at mid-latitudes, and then closer and closer to the equator until solar minimum is reached. This pattern is best visualized in the form of the so-called butterfly diagram, first constructed by the husband-wife team of E. Walter and Annie Maunder in the early twentieth century (see graph below). Images of the Sun are divided into latitudinal strips, and the monthly-averaged fractional surface of sunspots calculated. This is plotted vertically as a color-coded bar, and the process is repeated month after month to produce this time-latitude diagram.
Throughout the Little Ice Age, the world experienced heightened volcanic activity.[71] When a volcano erupts, its ash reaches high into the atmosphere and can spread to cover the whole earth. This ash cloud blocks out some of the incoming solar radiation, leading to worldwide cooling that can last up to two years after an eruption. Also emitted by eruptions is sulfur in the form of sulfur dioxide gas. When this gas reaches the stratosphere, it turns into sulfuric acid particles, which reflect the sun's rays, further reducing the amount of radiation reaching Earth's surface. The 1815 eruption of Tambora inIndonesia blanketed the atmosphere with ash; the following year, 1816, came to be known as the Year Without a Summer, when frost and snow were reported in June and July in both New England and Northern Europe. Other volcanoes that erupted during the era and may have contributed to the cooling include Billy Mitchell (ca. 1580), Mount Parker (1641), Long Island (Papua New Guinea) (ca. 1660), and Huaynaputina (1600).[19]
Billy Mitchell is a volcano located in the central part of the island of Bougainville, just northeast of the Bagana Volcano, in Papua New Guinea. It is a small pyroclastic shield truncated by a 2 km wide caldera filled by a crater lake.[2]
The last two major eruptions were more than 400 (in 1580 AD ± 20 years) and 900 years ago. They were among the largest Holocene eruptions in Papua New Guinea. Both were explosive eruptions with a Volcanic Explosivity Index of at least 5. The eruption that occurred in 1580 AD ± 20 years produced pyroclastic flows and caused the formation of its caldera.[3] The ignimbrite deposit from that eruption, which had a VEI of 6, extends 22 kilometres (14 mi) from the caldera to the coast, and its volume is around 10 cubic kilometres (2.4 cu mi).[1]
Mount Parker, locally known as Melibengoy, is a stratovolcano on Mindanao island in the Philippines (6°06.8' N, 124°53.5' E). It is located in the province of South Cotabato, 30 kilometers west of General Santos City and 44 kilometers south of Koronadal City.
The volcano's English name is taken from an American General, General Frank Parker, who spotted the mountain and claimed to have "discovered" it during a flight he piloted in 1934. General Parker led an expedition up to the lake in the mountain's crater with other US colonial and Filipino government officials, including Vice-Governor-General Joseph Ralston Hayden and Provincial Governor Gutierrez, in the fall of 1934.[4]
Two stratovolcanoes are located on the island: Mount Reaumur and Cerisy Peak. The summit of the volcanic complex collapsed during at least three major explosive eruptions, about 16,000, 4000, and 300 years ago. These produced a large caldera 10 x 12.5 km in size, now filled with a crater lake, Lake Wisdom. The last eruption was one of the largest in Papua New Guinea's recent history with an estimated air-fall volume in excess of 11 cu km,[1] comparable to the 1991 eruption of Mount Pinatubo, but the Global Volcanism Program gives a much higher estimate of 30 cu km. This cataclysmic event prompted legends of a "Time of Darkness". The most recent (and a smaller) eruption occurred in 1993.
Huaynaputina (from Quechua: Waynaputina, meaning "Young Volcano"; Pronounced:  i/hwaɪnɔːpʊtiːnʌh/ wh'eye-naw-puu-tee-nuh) is a stratovolcano located in a volcanic upland in southern Peru. The volcano does not have an identifiable mountain profile, but instead has the form of a large volcanic crater. It has produced high-potassium andesite and dacite.[2] On 19 February 1600, it exploded catastrophically (Volcanic Explosivity Index—or VEI—6), in the largest volcanic explosion in South America in historic times. The eruption continued with a series of events into March. An account of the event was included in Fray Antonio Vázquez de Espinosa's Compendio y Descripción de las Indias, which was translated into English as Compendium and description of the West Indies in 1942.
The 1815 eruption of Mount Tambora was one of the most powerful in recorded history and classified as a VEI-7 event. Mount Tambora is on the island of Sumbawa in Indonesia. The eruption that began on 10 April 1815[21] was followed by between six months and three years of increased steaming and small phreatic eruptions. The eruption column lowered global temperatures, and some experts believe this led to global cooling and worldwide harvest failures, sometimes known as the Year Without a Summer.[22]
Mount Tambora (or Tamboro) is an active stratovolcano on the island of Sumbawa, Indonesia. Sumbawa is flanked both to the north and south by oceanic crust, and Tambora was formed by the active subduction zone beneath it. This raised Mount Tambora as high as 4,300 m (14,100 ft),[4] making it, in the 18th century, one of the tallest peaks in the Indonesian archipelago. After a large magma chamber inside the mountain filled over the course of several decades, volcanic activity reached a historic climax in the eruption of 10 April 1815.[5] This eruption was approximately VEI-7, the only eruption unambiguously confirmed of that size since the Lake Taupo eruption in about 180 CE.[6] (The Heaven Lake eruption of Baekdu Mountain in c. 969 CE may have also been VEI-7.)
With an estimated ejecta volume of 160 km3 (38 cu mi), Tambora's 1815 outburst was the largest volcanic eruption in recorded history. The explosion was heard on Sumatra island more than 2,000 km (1,200 mi) away. Heavy volcanic ashfalls were observed as far away as Borneo, Sulawesi, Java and Maluku islands. Most deaths from the eruption were from starvation and disease, as the eruptive fallout ruined agricultural productivity in the local region. The death toll was at least 71,000 people, of whom 11,000–12,000 were killed directly by the eruption;[6] the often-cited figure of 92,000 people killed is believed to be overestimated.[7]
The eruption caused global climate anomalies that included the phenomenon known as "volcanic winter": 1816 became known as the "Year Without a Summer" because of the effect on North American and European weather. Crops failed and livestock died in much of the Northern Hemisphere, resulting in the worst famine of the 19th century.[6]
During an excavation in 2004, a team of archaeologists discovered cultural remains buried by the 1815 eruption.[8] They were kept intact beneath the 3 m (9.8 ft) deep pyroclastic deposits. At the site, dubbed the Pompeii of the East, the artefacts were preserved in the positions they had occupied in 1815.
Mount Tambora experienced several centuries of inactive dormancy before 1815, as the result of the gradual cooling of hydrous magma in a closed magma chamber.[9] Inside the chamber at depths between 1.5–4.5 km (0.93–2.8 mi), theexsolution of a high-pressure fluid magma formed during cooling and crystallisation of the magma. Overpressure of the chamber of about 4,000–5,000 bar (58,000–73,000 psi) was generated, and the temperature ranged from 700–850 °C (1,292–1,560 °F).[9] In 1812, the caldera began to rumble and generated a dark cloud.[4]
On 5 April 1815, a moderate-sized eruption occurred, followed by thunderous detonation sounds, heard in Makassar on Sulawesi, 380 km (240 mi) away, Batavia (now Jakarta) on Java 1,260 km (780 mi) away, and Ternate on the Molucca Islands 1,400 km (870 mi) away. On the morning of 6 April, volcanic ash began to fall in East Java with faint detonation sounds lasting until 10 April. What was first thought to be sound of firing guns was heard on 10 April on Sumatra island more than 2,600 km (1,600 mi) away.[23]
At about 7 p.m. on 10 April, the eruptions intensified.[4] Three columns of flame rose up and merged.[23] The whole mountain was turned into a flowing mass of "liquid fire".[23] Pumice stones of up to 20 cm (7.9 in) in diameter started to rain down at approximately 8 p.m., followed by ash at around 9–10 p.m. Pyroclastic flows cascaded down the mountain to the sea on all sides of the peninsula, wiping out the village of Tambora. Loud explosions were heard until the next evening, 11 April. The ash veil had spread as far as West Java and South Sulawesi. A "nitrous" odour was noticeable in Batavia and heavy tephra-tinged rain fell, finally receding between 11 and 17 April.[4]
The explosion is estimated to have been VEI 7.[24] It had roughly four times the energy of the 1883Krakatoa eruption, meaning that it was equivalent to an 800 Mt (3.3×10¹² MJ) explosion. An estimated 160 km3 (38 cu mi) of pyroclastic trachyandesite was ejected, weighing approximately 1.4e14 kg (3.1×10¹⁴ lb) (see above). This has left a caldera measuring 6–7 km (3.7–4.3 mi) across and 600–700 m (2,000–2,300 ft) deep.[4] The density of fallen ash in Makassar was 636 kg/m² (130.3 lb/sq ft).[25] Before the explosion, Mount Tambora was approximately 4,300 m (14,100 ft) high,[4] one of the tallest peaks in the Indonesian archipelago. After the explosion, it now measures only 2,851 m (9,354 ft).[26]
Impact of the eruption-
By most calculations, the eruption of Tambora was at least a full order of magnitude larger than that of Mount Pinatubo in 1991 (Graft et al. 1993). It is estimated that the top 1,220 metres (4,000 ft) of the mountain was reduced to rubble and ash as a result of the eruption, and was subsequently ejected from the mountain or fell into the new caldera, reducing Tambora's height by a third.[27] Around 100 cubic kilometers of rock was blasted into the air, eclipsing the estimated 10 cubic kilometers by its counterpart in Italy, Vesuvius (Williams 2012). Not only were rocks and ash expelled into the atmosphere, but toxic gases were pumped into the atmosphere as well. Many of the residents who survived the resulting tsunami, eruption, or ash cloud became sick due to all of the sulfur, which caused lung infections (Cole-Dai et al. 2009). Volcanic ash was documented to be over 100 cm deep in areas within 75 km of the eruption, while areas within a 500 km radius saw a 5 cm phoenix cloud ash fall,[clarification needed] and ash could be found as far away as 1300 km (Oppenheimer 2003). With this much volcanic ash on the ground, any crops or viable vegetation sources were smothered at a minimum and burned if they were close to the volcano itself. This created an immediate shortage of food in Indonesia, one that only compounded the regular shortage during the winter season (Cole-Dai et al. 2009). The ejection of these gasses, especially HCl, caused the precipitation that followed in the region to be extremely acidic, killing much of the crops that either survived or were rebudding during the spring. The food shortage was compounded by the Napoleonic wars, floods, and cholera.[6]
The presence of ash in the atmosphere for several months after the eruption reflected significant amounts of solar radiation, causing unseasonably cool summers which further drove populations to a food shortage.[6] China, Europe, and North America all had well-documented cases of abnormal temperatures, decimating their harvests. These climatic shifts also altered the monsoon season in China and India, forcing thousands of Chinese to flee coastal areas due to regional flooding of the Yangtze Valley (Granados et al. 2012). The gases also reflected some of the already decreased incoming solar radiation, causing a notable decrease in global temperatures throughout the decade, between 0.4-0.7 °C globally. It was so dramatic that that an ice dam was formed in Switzerland during the summer of 1816 and 1817, earning 1816 the title “Year without a summer” or YWAS.[28] The winter months of 1816 were not very different from years previous, but the spring and summer maintained the cool to freezing temperatures. However, the winter of 1817 radically differed, reaching temperatures below -30 °F in New York, which were cold enough to freeze lakes and rivers used for transporting supplies. Both Europe and North America suffered late freezes that lasted well into June with snow accumulating up to 32 cm in August, which killed recently planted crops, crippling the food industry. Unseasonably cool temperatures reduced the output of crops worldwide: the growing seasons in Massachusetts and New Hampshire were less than 80 days in 1816, citing freezing temperatures as the reason for harvest failure (Oppenheimer 2003). These were visually connected to unique sunsets observed in western Europe and red fog found on the Eastern Seaboard of the US. These unique atmospheric conditions persisted for the better part of 2.5 years (Robock 2000).
Ice cores have been used to monitor atmospheric gases during the cold decade (1810-1819) and the results are puzzling. The SO4 concentration found in both Siple Station, Antarctica and Central Greenland bounced from 5.0[clarification needed] in January 1816 to 1.1[clarification needed] in August 1818 (Dai et al. 1991). This means that 25-30 Tg of sulfur was ejected into the atmosphere, most of which would come from Tambora, and was equalized back by natural processes on Earth rather quickly. Another unique factor is that Tambora represents the largest shift in sulfur concentration in the ice cores for the past 5000 years, potentially becoming the single most disruptive event in recorded history. Estimates of the sulfur yield vary from 10 Tg (Black et al. 2012) to 120 Tg (Stothers 2000). The difference between the models are drastic, but many estimates will either average in or agree on a number between 25-30 Tg. The high concentration might explain the stratospheric warming of ~15 °C, resulting in surface cooling that would be a delayed reaction lasting for the next nine years. It is estimated that the stratospheric warming event only lasted four years, but cooler temperatures were documented until 1825 (Cole-Dai et al. 2009). The data presented did not state whether it was a statistically significant difference or just temperatures cooler than “normal.” This has been dubbed a “volcanic winter”, similar to a nuclear winter, due to the overall decrease and abysmal farming conditions.[6]
Climate data have shown that the variance between daily lows and highs may have played a role in the lower average temperature because the fluctuations were much more subdued. Generally, the mornings were warmer due to nightly cloud cover and the evenings were cooler because the clouds had dissipated. There were documented fluctuations of cloud cover for various locations that suggested it was a nightly occurrence and the sun killed them off, much like a fog (Oppenheimer 2003). The class boundaries between 1810-1830 without volcanically perturbed years was ~7.9 °C. This is contrasted by the volcanically perturbed years (1815-1817) where the delta was only ~2.3 °C. This meant that the mean annual cycle in 1816 was more linear than bell shaped and 1817 endured cooling across the board. Southeastern England, northern France, and the Netherlands experienced the greatest amount of cooling in Europe; complemented by New York, New Hampshire, Delaware, and Rhode Island in North America.[28]
The documented rainfall was as much as 80% more than the calculated normal with regards to 1816, unusually high amounts of snow were found in Switzerland, France, Germany, and Poland. This is again contrasted by the unusually low precipitations in 1818 which caused droughts throughout most of Europe and Asia (Auchmann et al. 2012). Russia had already experienced unseasonably warm and dry summers since 1815 and this continued for the next three years. There are also documented reductions in ocean temperature near the Baltic Sea, North Sea, and Mediterranean. This seems to have been an indicator of shifted oceanic circulation patterns and possibly changed wind direction and speed (Meronen et al. 2012). This is further supported by the recorded observations of a British fleet sent to explore the Arctic Circle; they found large ice sheets that were miles off the coast of Greenland, where two years prior they had been shoved along the eastern border of the island. Contemporary scientists attributed the Year Without a Summer to the drifting polar ice sheets rather than the eruption of Tambora because of its proximity to England.[6]
Taking into account the Dalton Minimum, and the presence of famine and droughts predating the eruption, the Tambora volcanic event accelerated or exacerbated the extreme climate conditions of 1815. While other eruptions and other climatological events would have led to a global cooling of about 0.2 °C, Tambora increased that number substantially (Dai et al. 1991). This is a case of extreme climate, not extreme weather. Several climate forcings coincided and interacted in a way not experienced since, even with large eruptions since early 20th century. Our current understanding of these events and their link to the Tambora event is well-defined; yet there are many concerns that our understanding of such an event is limited and would not prove substantial if a subsequent eruption of the same magnitude were to occur.
All vegetation on the island was destroyed. Uprooted trees, mixed with pumice ash, washed into the sea and formed rafts of up to 5 km (3.1 mi) across.[4]One pumice raft was found in the Indian Ocean, near Calcutta on 1 and 3 October 1815.[6] Clouds of thick ash still covered the summit on 23 April. Explosions ceased on 15 July, although smoke emissions were still observed as late as 23 August. Flames and rumbling aftershocks were reported in August 1819, four years after the event.
A moderate-sized tsunami struck the shores of various islands in the Indonesian archipelago on 10 April, with a height of up to 4 metres (13 ft) in Sanggar at around 10 p.m.[4] A tsunami of 1–2 m (3.3–6.6 ft) in height was reported in Besuki, East Java, before midnight, and one of 2 metres (6.6 ft) in height in the Molucca Islands. The total death-toll has been estimated at around 4,600.[29]
The eruption column reached the stratosphere, an altitude of more than 43 km (27 mi).[6] The coarser ash particles fell 1 to 2 weeks after the eruptions, but the finer ash particles stayed in the atmosphere from a few months up to a few years at an altitude of 10–30 km (6.2–19 mi).[4] Longitudinal winds spread these fine particles around the globe, creating optical phenomena. Prolonged and brilliantly coloured sunsets and twilights were frequently seen in London, England between 28 June and 2 July 1815 and 3 September and 7 October 1815.[4] The glow of the twilight sky typically appeared orange or red near the horizon and purple or pink above, influencing J. M. W. Turner's paintings.
The estimated number of deaths varies depending on the source. Zollinger (1855) puts the number of direct deaths at 10,000, probably caused by pyroclastic flows. On Sumbawa island, there were 38,000 deaths due to starvation, and another 10,000 deaths occurred due to disease and hunger on Lombok island.[30] Petroeschevsky (1949) estimated about 48,000 and 44,000 people were killed on Sumbawa and Lombok, respectively.[31] Several authors use Petroeschevsky's figures, such as Stothers (1984), who cites 88,000 deaths in total.[4] However, Tanguy et al.. (1998) claimed Petroeschevsky's figures to be unfounded and based on untraceable references.[7] Tanguy revised the number solely based on two credible sources, q.e., Zollinger, who himself spent several months on Sumbawa after the eruption, and Raffles's notes.[23] Tanguy pointed out that there may have been additional victims on Bali and East Java because of famine and disease. Their estimate was 11,000 deaths from direct volcanic effects and 49,000 by post-eruption famine and epidemic diseases.[7] Oppenheimer (2003) stated a modified number of at least 71,000 deaths in total, as seen in Table I below.[6]
The 1815 eruption released sulfur dioxide (SO2) into the stratosphere, causing a global climate anomaly. Different methods have estimated the ejected sulphur mass during the eruption: the petrological method; an optical depth measurement based on anatomical observations; and the polar ice core sulfate concentration method, using cores from Greenland and Antarctica. The figures vary depending on the method, ranging from 10 to 120 million tonnes.[6]
In the spring and summer of 1815, a persistent dry fog was observed in the northeastern United States. The fog reddened and dimmed the sunlight, such that sunspots were visible to the naked eye. Neither wind nor rainfall dispersed the "fog". It was identified as a stratospheric sulfate aerosol veil.[6] In summer 1816, countries in the Northern Hemisphere suffered extreme weather conditions, dubbed the Year Without a Summer. Average global temperatures decreased about 0.4–0.7 °C (0.7–1.3 °F),[4] enough to cause significant agricultural problems around the globe. On 4 June 1816, frosts were reported in Connecticut, and by the following day, most of New England was gripped by the cold front. On 6 June 1816, snow fell inAlbany, New York, and Dennysville, Maine.[6] Such conditions occurred for at least three months and ruined most agricultural crops in North America. Canada experienced extreme cold during that summer. Snow 30 cm (12 in) deep accumulated near Quebec City from 6 to 10 June 1816.
1816 was the second coldest year in the northern hemisphere since 1400 CE, after 1601 following the 1600 Huaynaputina eruption in Peru.[24] The 1810s are the coldest decade on record, a result of Tambora's 1815 eruption and other suspected eruptions somewhere between 1809 and 1810 (see sulfate concentration figure from ice core data). The surface temperature anomalies during the summer of 1816, 1817 and 1818 were −0.51 °C (−0.92 °F), −0.44 °C (−0.79 °F) and −0.29 °C (−0.52 °F), respectively.[24] As well as a cooler summer, parts of Europe experienced a stormier winter.
This pattern of climate anomaly has been blamed for the severity of typhus epidemic in southeast Europe and the eastern Mediterranean between 1816 and 1819.[6] The climate changes disrupted Indian monsoons causing three failed harvests and famine contributing to worldwide spread of a new strain of cholera originating in Bengal in 1816.[33] Much livestock died in New England during the winter of 1816–1817. Cool temperatures and heavy rains resulted in failed harvests in the United Kingdom of Great Britain and Ireland. Families in Wales travelled long distances as refugees, begging for food. Famine was prevalent in north and southwest Ireland, following the failure of wheat, oat and potato harvests. The crisis was severe in Germany, where food prices rose sharply. Due to the unknown cause of the problems, demonstrations in front of grain markets and bakeries, followed by riots, arson and looting, took place in many European cities. It was the worst famine of the 19th century.[6]
The conditions during the northern hemisphere summer of 1816 were the result of the largest observed eruption in recorded human history, one during which global temperatures decreased by an average of 0.53 °C, and related human deaths were reported to be about 90,000. The importance of volcanic eruptions during this anomaly, specifically the eruption of Mount Tambora, cannot be overlooked. It is the most significant factor in this important climate anomaly across the globe (Robock 2000). While there were other eruptions during the year of 1815, Tambora is classified as a VEI-7 and an eruption column 45 km tall, eclipsing all others by at least one order of magnitude.
The Volcanic Explosivity Index (VEI) is used to quantify the amount of ejected material with a VEI-7 coming in at 100 km3. Every index value below that is one order of magnitude less. Furthermore, the 1815 eruption occurred during a Dalton Minimum, a period of unusually low solar radiation (Auchmann et al. 2012). Volcanism plays a large role in climate shifts, both locally and globally. This was not always understood and did not enter scientific circles as fact until Krakatau erupted in 1883 and tinted the skies orange (Robock 2000).
The scale of the volcanic eruption will determine the significance of the impact on climate and other chemical processes, but a change will be measured even in the most local of environments. When volcanoes erupt they eject CO2, H2O, H2, SO2, HCl, HF, and many other gases (Meronen et al. 2012). CO2 and H2O are greenhouse gases, responsible for 0.0394% and 0.4% of the atmosphere respectively. Their small ratio disguises their significant role in trapping solar insolation and reradiating it back to Earth.
Comparison of selected volcanic eruptions-
| Eruptions | Country | Location | Year | Column height (km) | Volcanic Explosivity Index | N. hemisphere summer anomaly (°C) | Fatalities |
|---|---|---|---|---|---|---|---|
| Mount Vesuvius | Italy | Mediterranean | 79 | 30 | 5 | ? | >2,000 |
| Hatepe (Taupo) | New Zealand | Pacific Ring of Fire | 186 | 51 | 7 | ? | ? |
| Baekdu | China / North Korea | Pacific Ring of Fire | 969 | 25 | 6–7 | ? | ? |
| Kuwae | Vanuatu | Pacific Ring of Fire | 1452 | ? | 6 | −0.5 | ? |
| Huaynaputina | Peru | Pacific Ring of Fire | 1600 | 46 | 6 | −0.8 | ≈1,400 |
| Tambora | Indonesia | Pacific Ring of Fire | 1815 | 43 | 7 | −0.5 | >71,000 |
| Krakatoa | Indonesia | Pacific Ring of Fire | 1883 | 36 | 6 | −0.3 | 36,600 |
| Santa María | Guatemala | Pacific Ring of Fire | 1902 | 34 | 6 | no anomaly | 7,000–13,000 |
| Novarupta | USA, Alaska | Pacific Ring of Fire | 1912 | 32 | 6 | −0.4 | 2 |
| Mt. St. Helens | USA, Washington | Pacific Ring of Fire | 1980 | 19 | 5 | no anomaly | 57 |
| El Chichón | Mexico | Pacific Ring of Fire | 1982 | 32 | 4–5 | YES | >2,000 |
| Nevado del Ruiz | Colombia | Pacific Ring of Fire | 1985 | 27 | 3 | no anomaly | 23,000 |
| Pinatubo | Philippines | Pacific Ring of Fire | 1991 | 34 | 6 | −0.5 | 1,202 |
The Truth Is Stranger Than Fiction!
My Web Page Is Best Viewed With Google Chrome.


Comments
Post a Comment
Your comments, questions, and feedback on this post/web page are welcome.